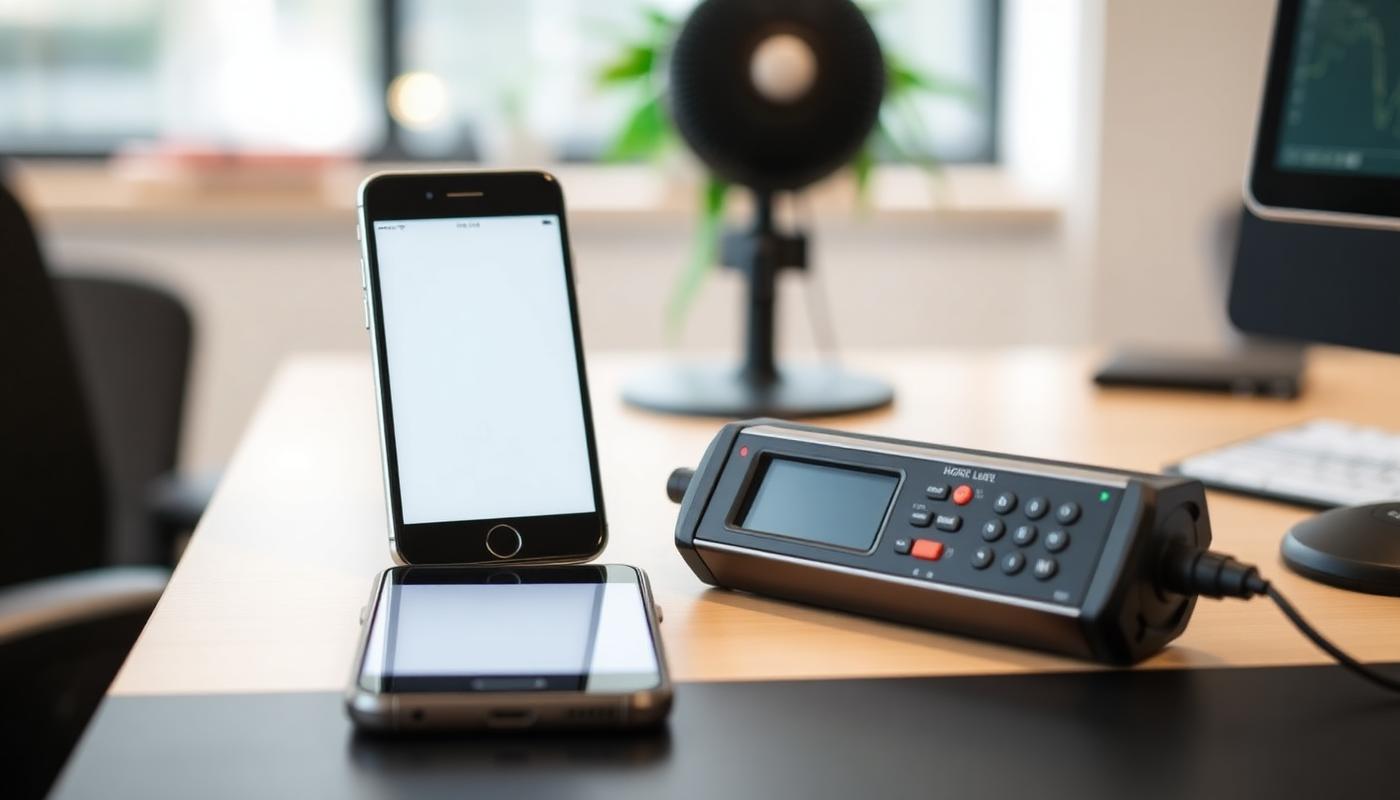
How Accurate Are Phone Noise Meters?
Last updated: July 25, 2026
Reviewed by acoustic research sources and WHO guidelines.
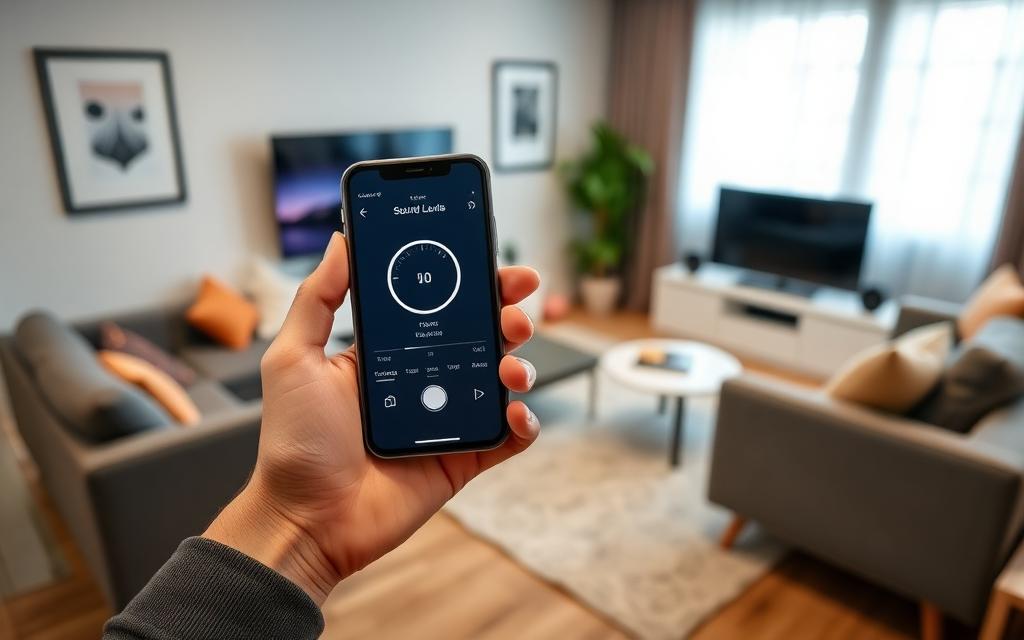
The most common question about phone-based noise measurement is: "Can I trust the reading?" The short answer is yes — for most everyday purposes. But the details matter, and understanding the limitations helps you use phone meters effectively.
Table of Contents
- How Phone Microphones Work
- Accuracy vs Professional Meters
- Factors That Affect Accuracy
- When Phone Measurements Are Reliable
- When You Need Professional Equipment
- Tips for Better Phone Measurements
- FAQ
Test your phone's noise measurement right now. [Open the free online noise meter](/) — no download needed.
How Phone Microphones Work
Modern smartphones use MEMS (Micro-Electro-Mechanical Systems) microphones — tiny silicon chips containing a diaphragm that vibrates in response to sound pressure. These vibrations generate proportional electrical signals that are digitized by an analog-to-digital converter.
Phone microphones are primarily designed for voice communication, optimized for speech clarity between 300 Hz and 3,400 Hz. They include automatic gain control (AGC) that dynamically adjusts sensitivity — useful for phone calls but a complicating factor for calibrated measurement.
Despite these design priorities, MEMS microphones have improved dramatically. Flagship phones from Apple, Samsung, and Google now include multiple microphones with noise cancellation capabilities, providing a broader and more accurate frequency response than older devices.
Accuracy vs Professional Meters
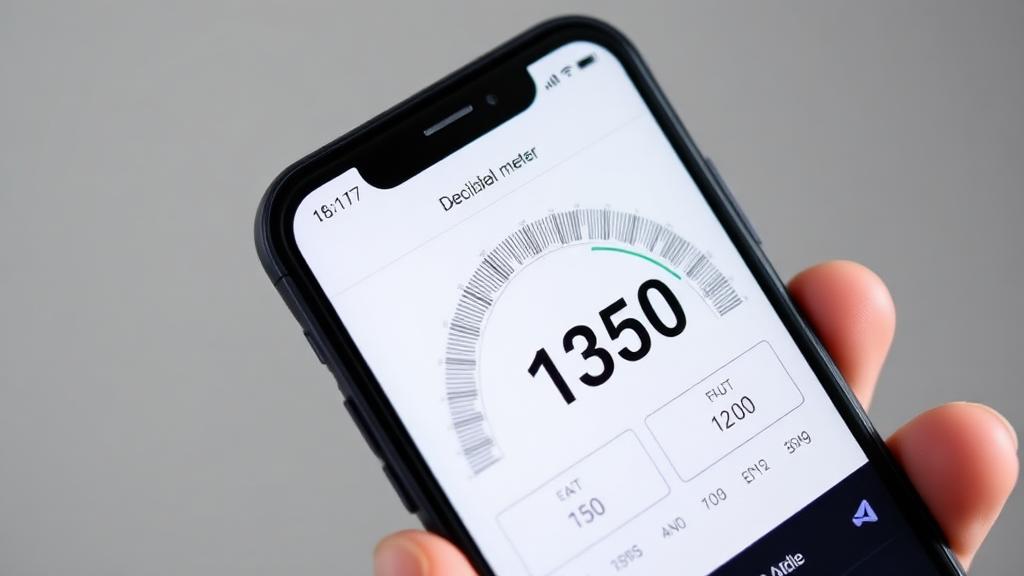
Research published in the Journal of the Acoustical Society of America compared smartphone noise meter apps against Class 2 professional instruments. Key findings:
| Aspect | Phone Noise Meters | Professional (Class 2) |
|---|---|---|
| Typical accuracy | ±3–5 dB | ±1 dB |
| Best accuracy range | 45–85 dB | 30–130 dB |
| Low-level accuracy | Poor below 35 dB | Reliable to 30 dB |
| High-level accuracy | May clip above 95 dB | Reliable to 130+ dB |
| Frequency weighting | Approximate A-weighting | Calibrated A/C/Z |
| Cost | Free | $200–$2,000+ |
The key takeaway: for indoor environments in the 40–85 dB range — which covers bedrooms, offices, restaurants, and most home situations — phone measurements are practical and useful.
Factors That Affect Accuracy
Several factors influence how accurate your phone measurement will be:
Device Quality
Newer, higher-quality devices generally produce better measurements. The iPhone 14/15 series and Samsung Galaxy S23/S24 have been shown to be among the most accurate consumer devices for noise measurement.
Microphone Position
Phone microphones are located at different positions depending on the model — bottom edge, top edge, or multiple locations. Knowing where your microphone is helps you orient the device correctly.
Background Processing
Some phones apply noise reduction algorithms that can suppress certain sounds and alter readings. Using a browser-based tool like SnapRoomScore that accesses raw microphone input typically provides more reliable readings than native phone features.
Environmental Conditions
Wind, handling noise, and phone case materials can all affect readings. Placing the phone on a stable surface away from vibrations produces more consistent results.
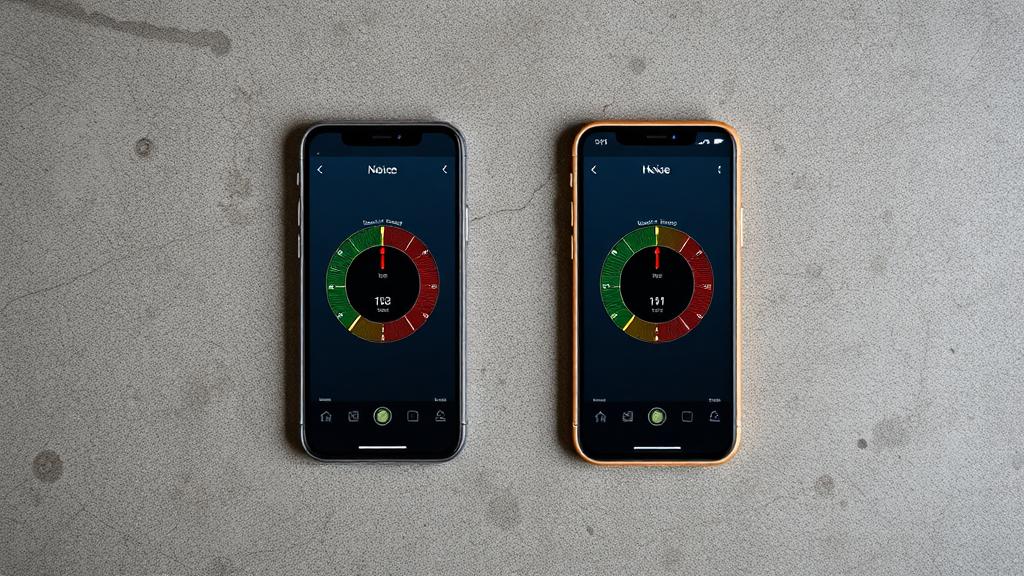
See how your phone performs. [Measure your room now with SnapRoomScore](/) — compare readings across different locations.
When Phone Measurements Are Reliable
Phone-based noise meters are excellent for:
- Comparing environments — Is bedroom A quieter than bedroom B?
- Tracking trends over time — Is your office getting louder?
- Before-and-after testing — Did those curtains reduce noise?
- General awareness — Is this café suitable for focused work?
- Sleep assessment — Is my bedroom quiet enough?
For these use cases, the ±3–5 dB variation is well within useful range. You do not need ±1 dB precision to determine whether your bedroom at 42 dB exceeds the WHO's 30 dB sleep recommendation.
Learn more about how to measure noise with your phone.
When You Need Professional Equipment
Consider professional measurement if you:
- Need legally valid noise documentation for complaints or compliance
- Are assessing occupational noise for OSHA/NIOSH compliance
- Require measurements below 35 dB or above 95 dB
- Are designing acoustic treatment for studios or performance spaces
- Need frequency-specific analysis (octave band measurements)
For most home, office, and lifestyle purposes, a browser-based tool provides everything you need.
Tips for Better Phone Measurements
- Place your phone on a stable surface — avoid holding it in your hand
- Position the microphone toward the sound source — or toward the center of the room
- Measure for at least 30–60 seconds to get a reliable average
- Remove bulky phone cases if possible
- Close other apps that might use the microphone
- Measure at different times to capture variations
- Use the [trends feature](/trends) to track patterns over time
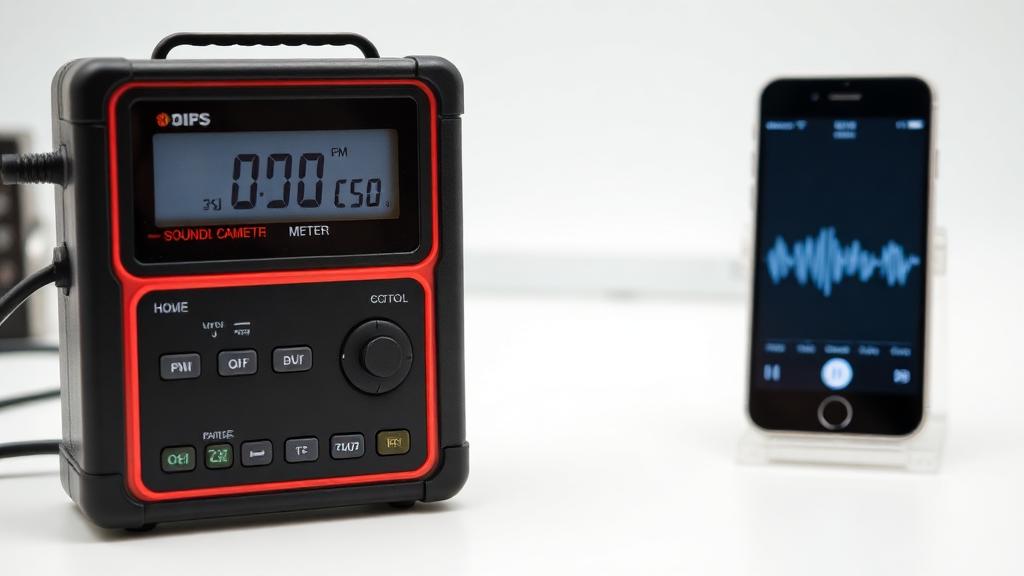
Where the Error Actually Comes From
"±3–5 dB" is an average, not a fixed offset. Five separate sources stack up, and knowing which one dominates tells you whether a reading can be trusted:
| Error source | Typical size | When it bites |
|---|---|---|
| Microphone noise floor | up to ±8 dB | Very quiet rooms below 35 dB |
| Automatic gain control | ±3–6 dB | Sudden loud events, speech nearby |
| Clipping at the ADC | −5 to −15 dB (under-reads) | Above 95 dB |
| A-weighting approximation | ±2 dB | Bass-heavy or very bright sources |
| Placement and handling | ±2–5 dB | Handheld, near walls, in a pocket |
Notice that three of the five are user-controllable. Putting the phone on a hard surface at least 1 m from a wall, taking the case off and staying quiet during the reading removes most of the practical error — usually leaving you inside ±3 dB in the range that matters.
Browser Tools vs Native Apps
Native noise apps and browser tools read the same microphone, but the audio path differs. Many native apps receive audio through the phone's voice-processing chain, which applies noise suppression, echo cancellation and gain control tuned for calls. That processing is invisible and actively distorts absolute levels.
SnapRoomScore requests the raw stream with echo cancellation, noise suppression and automatic gain control explicitly disabled, computes RMS directly from the raw audio samples in the browser, and routes the output to a zero-gain destination so nothing is played back. No audio leaves the device and nothing is recorded. The trade-off is that browsers cannot access a calibration profile for your specific handset — which is exactly why we publish an accuracy disclaimer rather than claiming meter-grade precision.
How to Sanity-Check Your Phone in 5 Minutes
You can validate your device without buying anything:
- Find your floor. Measure the quietest room in your home at night. If it reads 28–32 dB, that is likely the microphone floor, not the room.
- Check a known level. Normal conversation at 1 m should land near 60 dB. A running vacuum at 1 m should land near 70–75 dB.
- Test repeatability. Take three 30-second readings in the same spot. Spread should be under 2 dB; more means something in the room is changing, not the phone.
- Compare two devices. If a second phone reads consistently 4 dB higher, treat the difference as an offset and always use the same device for comparisons.
- Log it. Save the baseline on the trends page so future readings have something to be measured against.
Consistency beats absolute accuracy for every decision this tool is designed to support: is the room quiet enough, and did my change help?
Which Devices Perform Best
Measured against Class 2 references in published comparisons, three patterns hold:
- iPhones are the most consistent because Apple ships a narrow hardware range, so a given model behaves the same everywhere.
- Recent flagship Android devices (Galaxy S-series, Pixel) sit within a few dB of iPhones; budget Android handsets vary the most, sometimes by 6–8 dB.
- Laptops read low. Built-in laptop microphones sit behind aggressive processing and often under-report by 5–10 dB. Use a phone when the number matters.
iPhone Decibel Meter Accuracy
Apple's own studies with NIOSH found that an iPhone running a well-implemented sound level app agreed with a Class 2 reference within about ±2 dB across the 65–95 dB range — the best result of any consumer device category tested.
Three details drive that performance:
- Uniform hardware. Every iPhone 13, for example, uses the same microphone assembly, so a correction factor that works on one unit works on all of them.
- Bottom microphone selection. iOS apps can request the bottom mic, which is the least processed of the three.
- Predictable clipping ceiling. iPhone microphones clip around 105–110 dB, so readings below 100 dB stay linear.
The practical limits are the same as on any phone: below about 40 dB the microphone's own noise floor dominates, and above 100 dB the reading compresses. Remove the case, avoid covering the bottom edge, and don't measure while charging over a noisy adapter.
Apple Watch Noise App: How Accurate Is It?
The Apple Watch Noise app (Series 4 and later) is the most rigorously validated consumer noise measurement available. It uses A-weighting, samples continuously in the background, and warns you when the ambient level exceeds a threshold you set between 80 and 100 dB.
In Apple's validation work it tracked reference meters within roughly ±3 dB between 60 and 100 dB. Its weaknesses are worth knowing:
- It stops measuring during a phone call or when the microphone is otherwise in use.
- Readings are logged as averages over the sampling window, so brief impulse peaks (a slammed door, a gunshot) are under-reported.
- A wrist-worn microphone is partially shadowed by your body and sleeve, which typically costs a few dB.
For room assessment, a phone or laptop placed on a stable surface gives a cleaner reading than a watch on a moving wrist. The watch is better suited to tracking your personal daily noise dose over time.
Start measuring now. [Open SnapRoomScore](/) — free, instant, and works on any device with a browser.
FAQ
How accurate is a phone noise meter?
Research shows phone noise meters typically agree with professional Class 2 meters within ±3–5 dB in the 45–85 dB range on recent devices. Accuracy degrades at very low or very high levels.
Should I calibrate my phone for noise measurement?
For general awareness and relative comparisons, calibration is not needed. Browser-based tools like SnapRoomScore work directly with your device microphone and provide useful readings without setup.
When do I need a professional sound meter?
Professional meters are needed for legally valid measurements, occupational compliance testing, precise acoustic design, and situations where accuracy within ±1 dB is required.
Why does my phone always read around 30 dB in a silent room?
That is the microphone's own noise floor. Consumer MEMS microphones generate roughly 25–30 dBA of self-noise, so genuinely silent and very quiet rooms both bottom out near 30 dB.
Are iPhone or Android noise meters more accurate?
iPhones tend to be more consistent because the hardware range is narrow. Recent Android flagships perform comparably, while budget Android devices show the widest spread — sometimes 6–8 dB between models.
Is a laptop microphone good enough to measure noise?
Usually not. Laptop microphones sit behind heavy voice processing and commonly under-report by 5–10 dB. Use a phone when the absolute number matters.